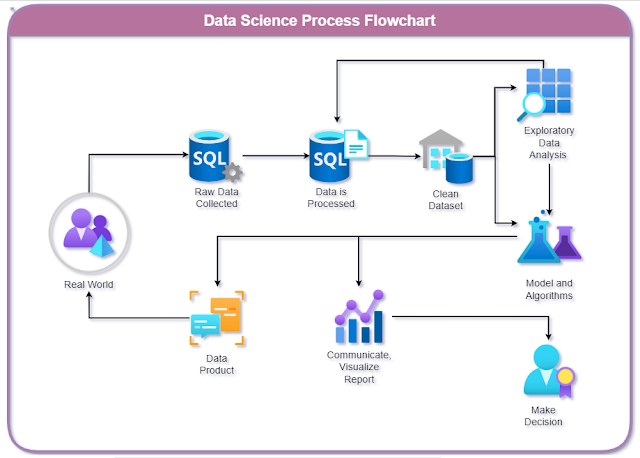
Diagram 2 - draw.io (Initial Idea 1)
Diagram: Data Science Process Flowchart
- Define objectives: Work with your customer and other stakeholders to understand and identify the business problems. Formulate questions that define the business goals that the data science techniques can target.
- Identify data sources: Find the relevant data that helps you answer the questions that define the objectives of the project. (Microsoft Learn, 2023)
- Data mining, also known as knowledge discovery in data (KDD), is the process of uncovering patterns and other valuable information from large data sets. (IBM, 2023)
- Data scrubbing, or data cleaning, is the process of standardizing the data according to a predetermined format. It includes handling missing data, fixing data errors, and removing any data outliers. Some examples of data scrubbing are:·
- Changing all date values to a common standard format.·
- Fixing spelling mistakes or additional spaces.·
- Fixing mathematical inaccuracies or removing commas from large numbers. (Amazon, 2023)
- Data exploration is preliminary data analysis that is used for planning further data modelling strategies. Data scientists gain an initial understanding of the data using descriptive statistics and data visualization tools. Then they explore the data to identify interesting patterns that can be studied or actioned. (Amazon, 2023)
- Feature engineering, in simple terms, is the act of converting raw observations into desired features using statistical or machine-learning approaches. (Patel, 2021)
- Software and machine learning algorithms are used to gain deeper insights, predict outcomes, and prescribe the best course of action. Machine learning techniques like association, classification, and clustering are applied to the training data set. The model might be tested against predetermined test data to assess result accuracy. The data model can be fine-tuned many times to improve result outcomes. (Amazon, 2023)
- Data scientists work together with analysts and businesses to convert data insights into action. They make diagrams, graphs, and charts to represent trends and predictions. Data summarization helps stakeholders understand and implement results effectively. (Amazon, 2023)
Amazon (2023) What is Data Science. The University. Available at: https://aws.amazon.com/what-is/data-science (Accessed: April 19, 2023).
IBM (2023) What is data mining?. Available at: https://www.ibm.com/topics/data-mining (Accessed: April 19, 2023).
Microsoft Learn (2023) Data acquisition and understanding of Team Data Science Process - Azure Architecture Center, Microsoft Learn. Available at: https://learn.microsoft.com/en-us/azure/architecture/data-science-process/lifecycle-data (Accessed: April 19, 2023).
Patel, H. (2021) What is feature engineering - importance, tools and techniques for machine learning, Medium. Towards Data Science. Available at: https://towardsdatascience.com/what-is-feature-engineering-importance-tools-and-techniques-for-machine-learning-2080b0269f10 (Accessed: April 19, 2023).

Comments
Post a Comment